Jan Krieger
JKQtPlotter
This is an extensive Qt5 Plotter framework (including a feature-richt plotter widget, a speed-optimized, but limited variant and a LaTeX equation renderer!), written fully in C/C++ and without external dependencies.
JKQTPlotter - A Qt Plotting Library
This software is licensed under the term of the GNU Lesser General Public License 2.1 (LGPL 2.1) or above.
- SourceRepositpry: https://github.com/jkriege2/JKQtPlotter
- Latest Release: https://github.com/jkriege2/JKQtPlotter/releases
- Documentation: https://jkriege2.github.io/JKQtPlotter/index.html
- Examples: https://jkriege2.github.io/JKQtPlotter/exampletutorialprojects.html
- Screenshots: https://github.com/jkriege2/JKQtPlotter/tree/master/screenshots
Main Features
- 2D Plotter widget class (JKQTPlotter)
- high-quality plotting
- no other dependencies than Qt >= 5.0
- highly customizable axes/grids (linear/log, date/time, custom ticks ...)
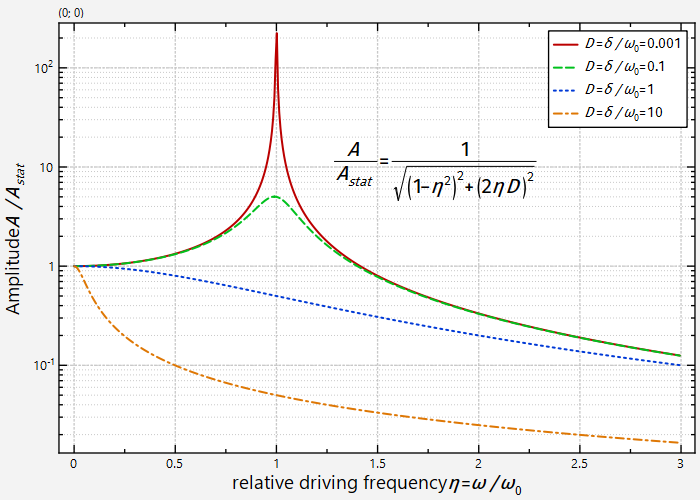
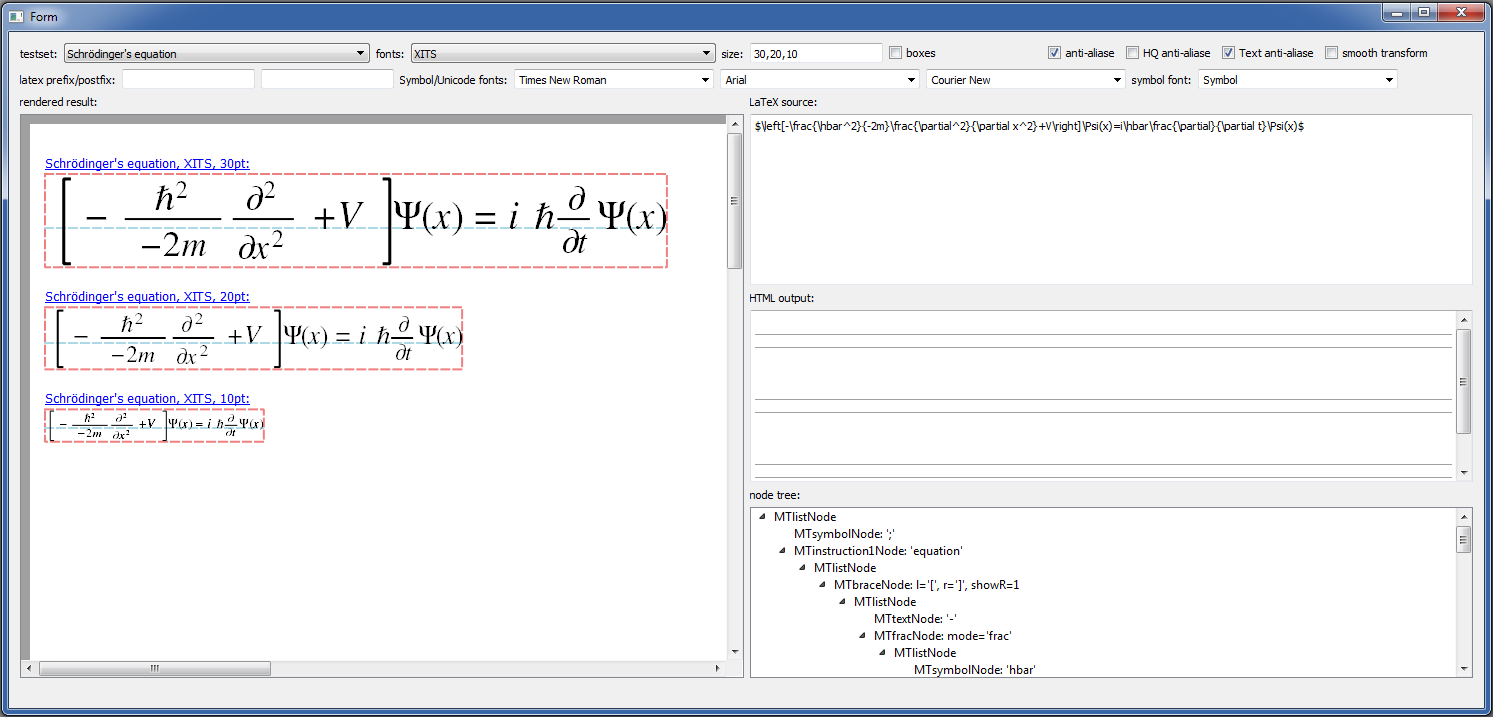
- integrated LaTeX parser (pure C++, no dependencies) to render mathematical equations in axis labels, ticks, ...
- extensive user-interactions pre-programmed (several zooming modes, selecting regions, custom context menus, switch graph visibility, ...)
- full print and export (PDF,PNG,...) support with preview and parametrization out-the-box
- highly customizable look and feel
- supports the Qt layout system for graphs and allows to synchronize several graphs with each other
- centralized data management in an internal data store:
- data organized by columns, can also represent image data (ropw-major)
- allows to reuse a column in several graphs
- access via Qt's model view framework
- external or internal datasets
- complete with GUI (table view)
- export capabilities (e.g. to CSV, SYLK, ...)
- C++ standard iterator interface
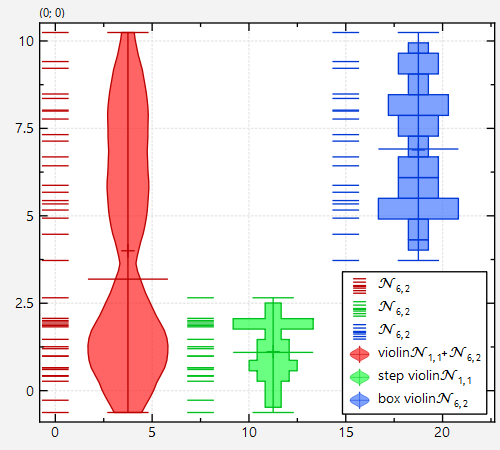
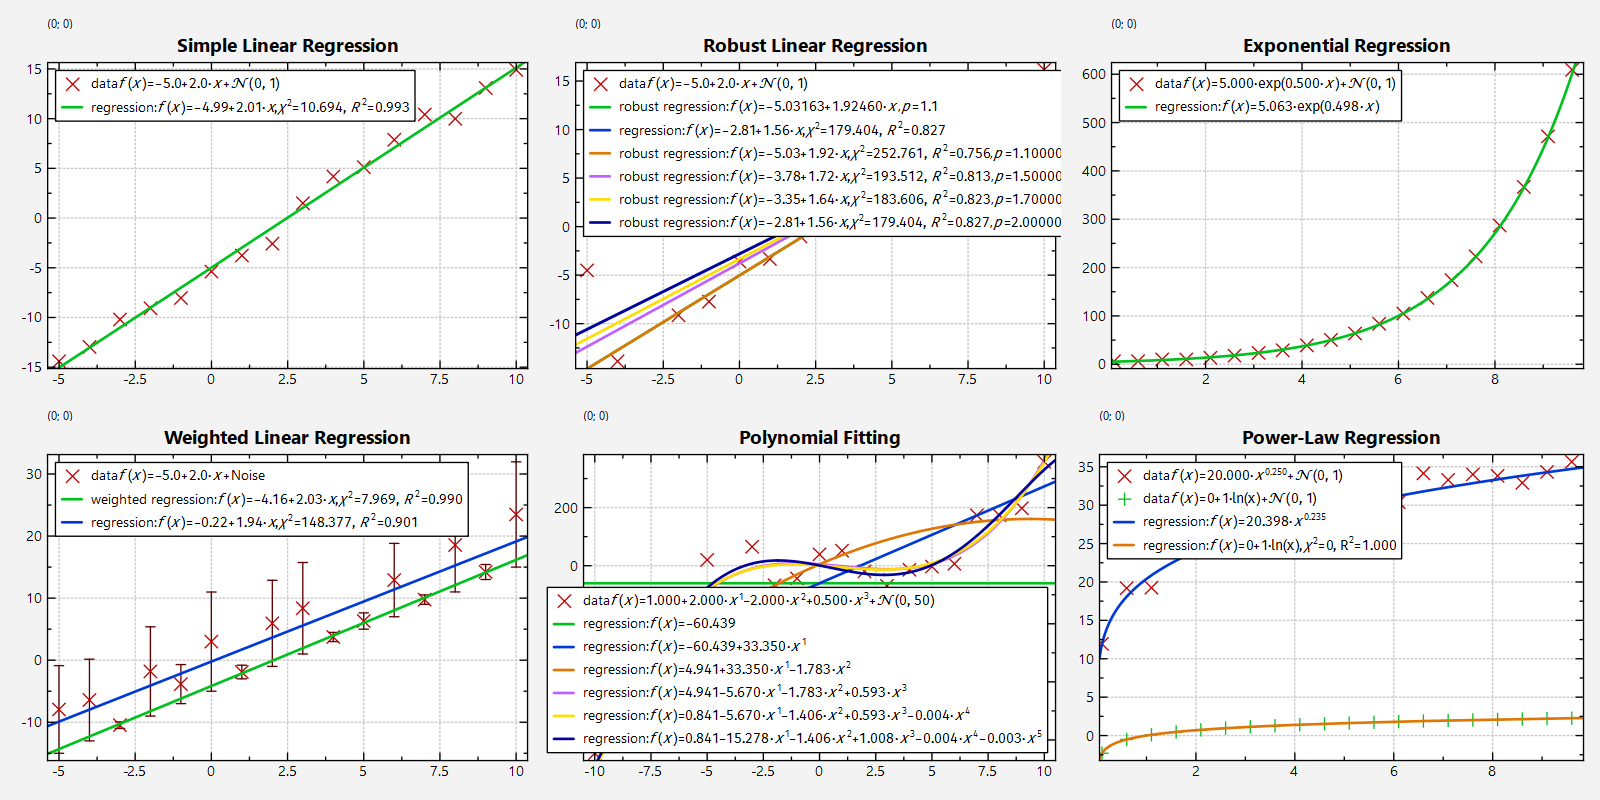
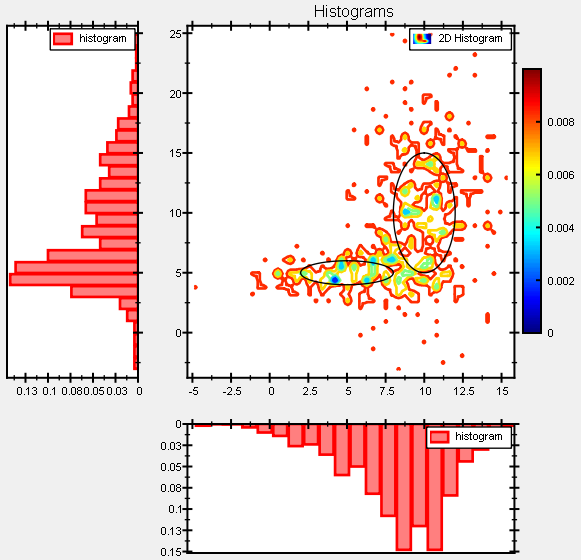
- statistics library (basic statistics, boxplots, histograms, kernel density estimates, regression analysis, polynomial fitting)
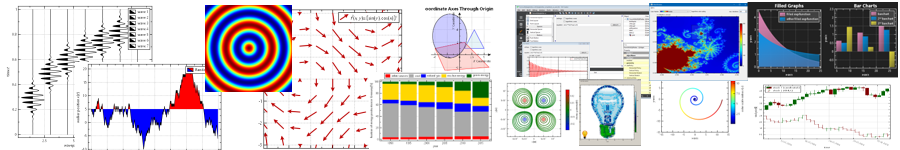
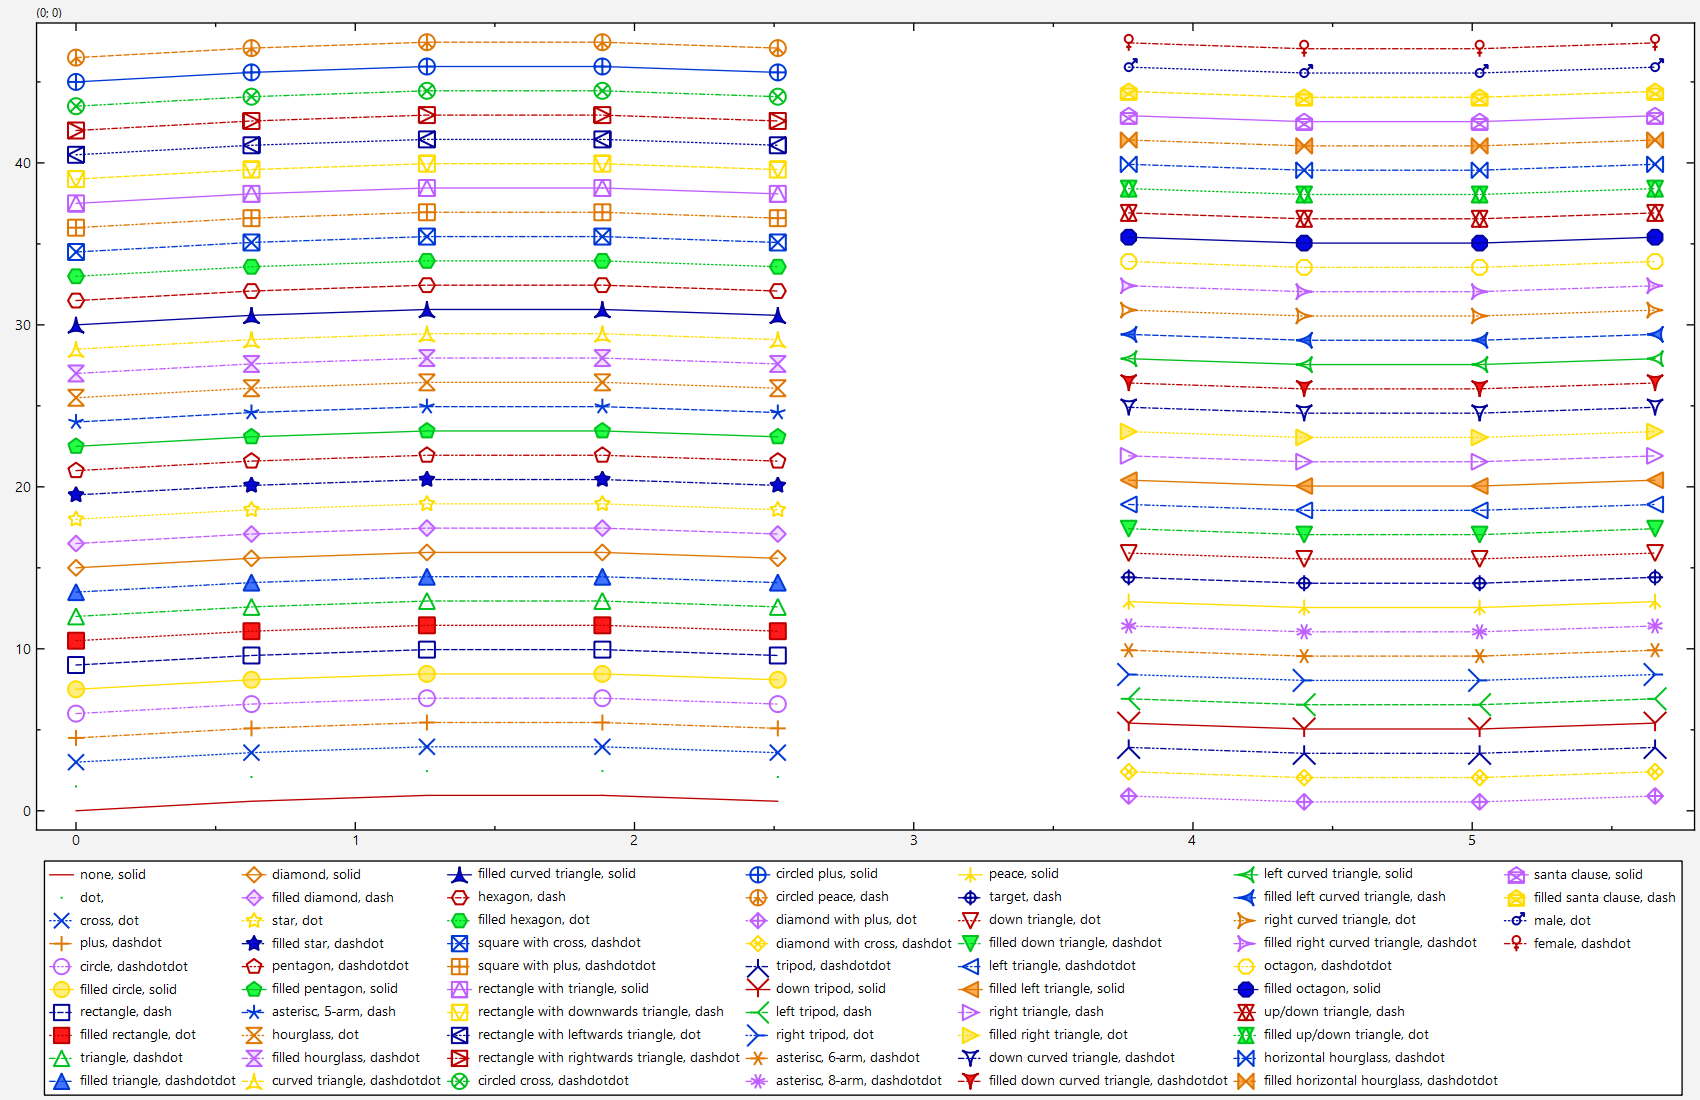
- large variety of graphs that can be added to a plot, e.g.:
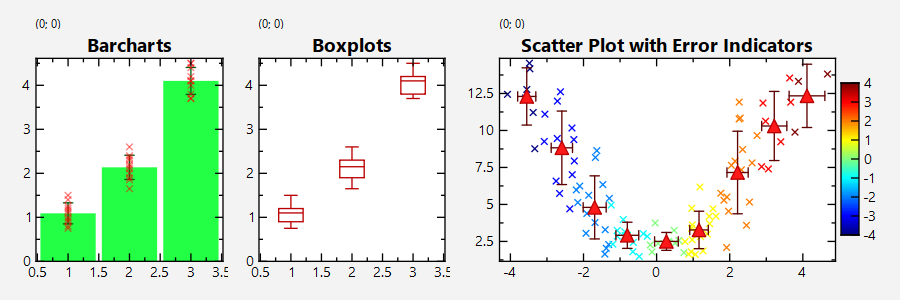
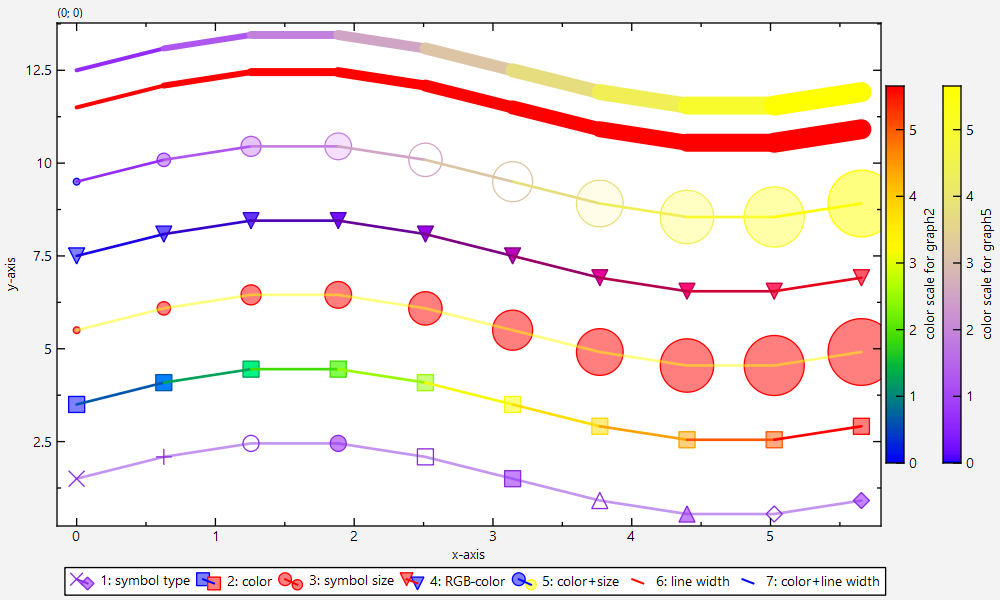
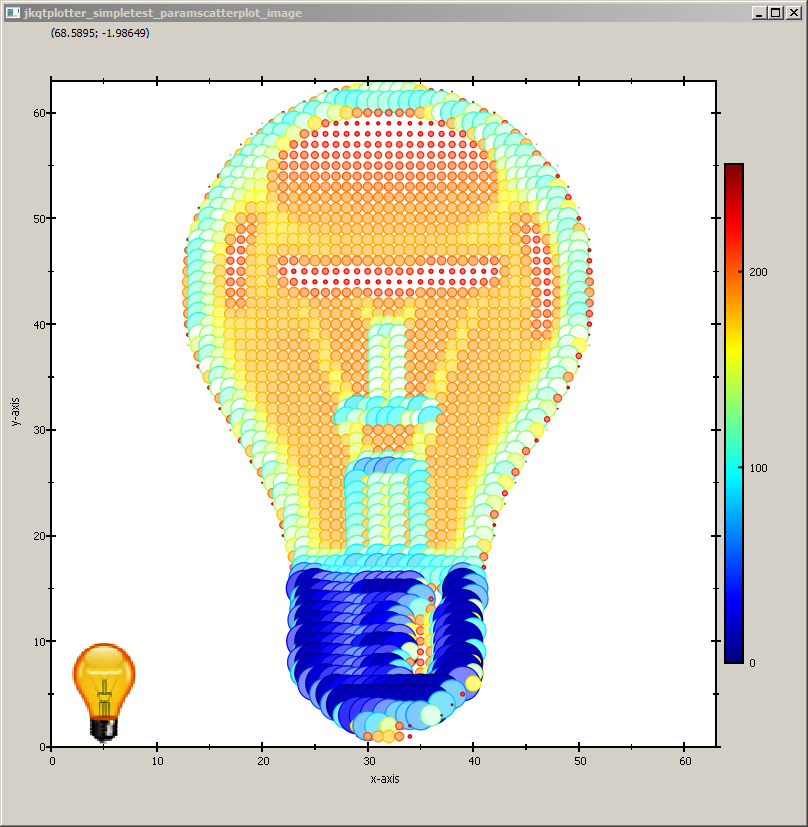
- scatter-plots (also parametrized color/size/symbol by a third data-column)
- line graphs, step graphs, impulses
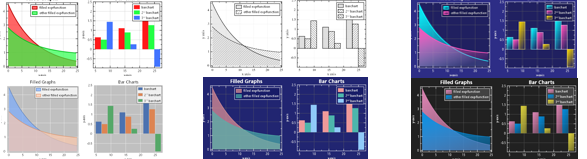
- filled curves
- bar charts (also stacked)
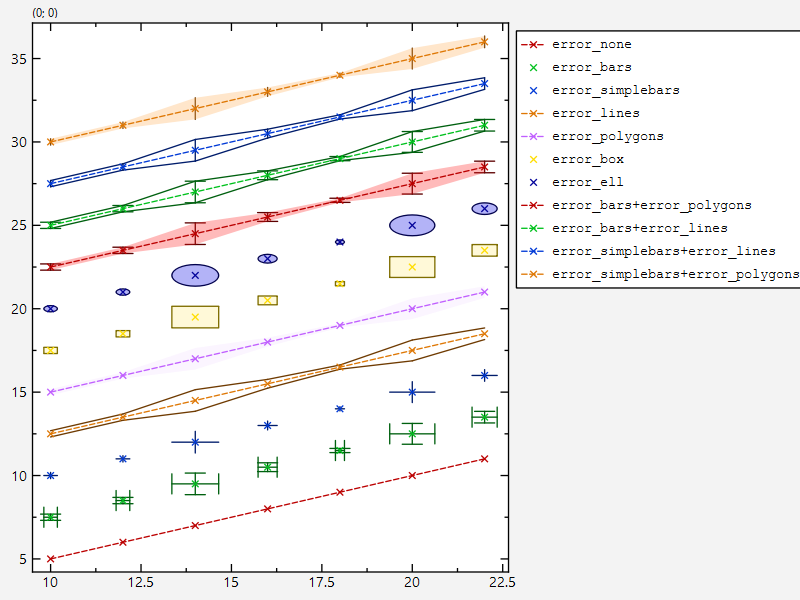
- extensive support for different styles of error indicators
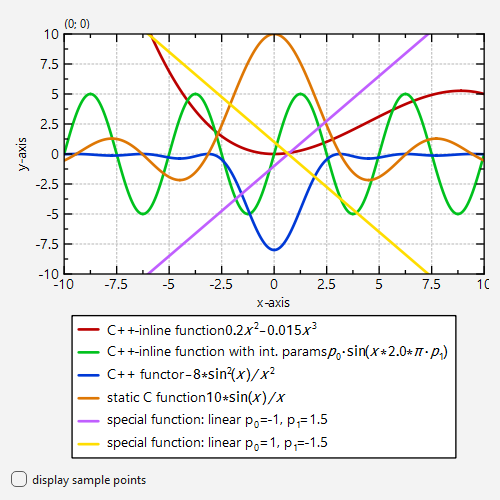
- integrated mathematical function parser for function plots (with intelligent rendering algorithm)
- line/scatter graphs can also be based on C/C++ functions instead of data series (C++11 support!)
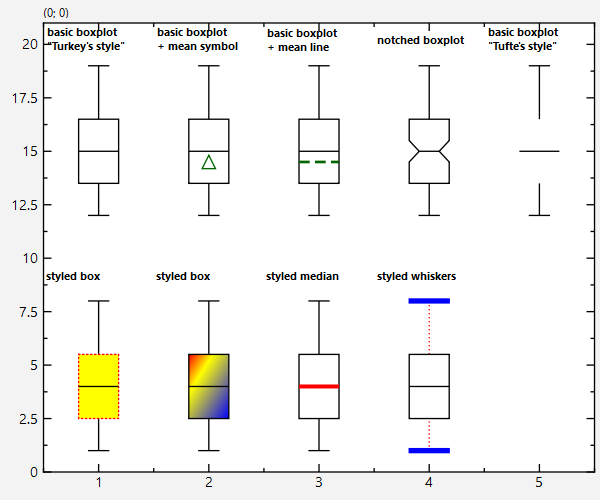
- statistical plots (e.g. boxplots)
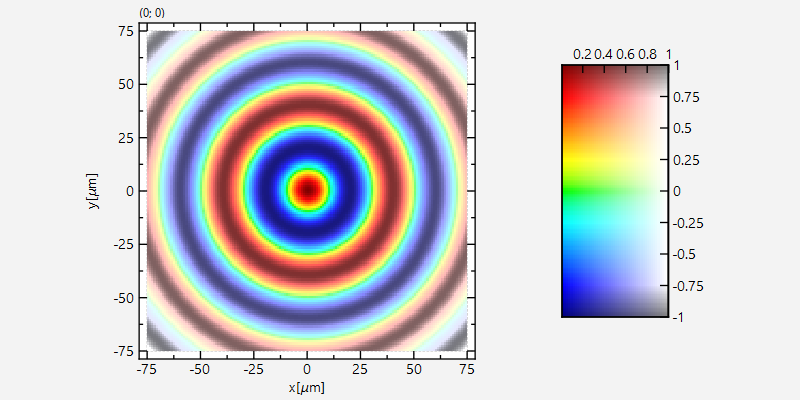
- extensive library of image plots (including different color-scale modes, RGBA-plots, overlays/masks)
- contour plots
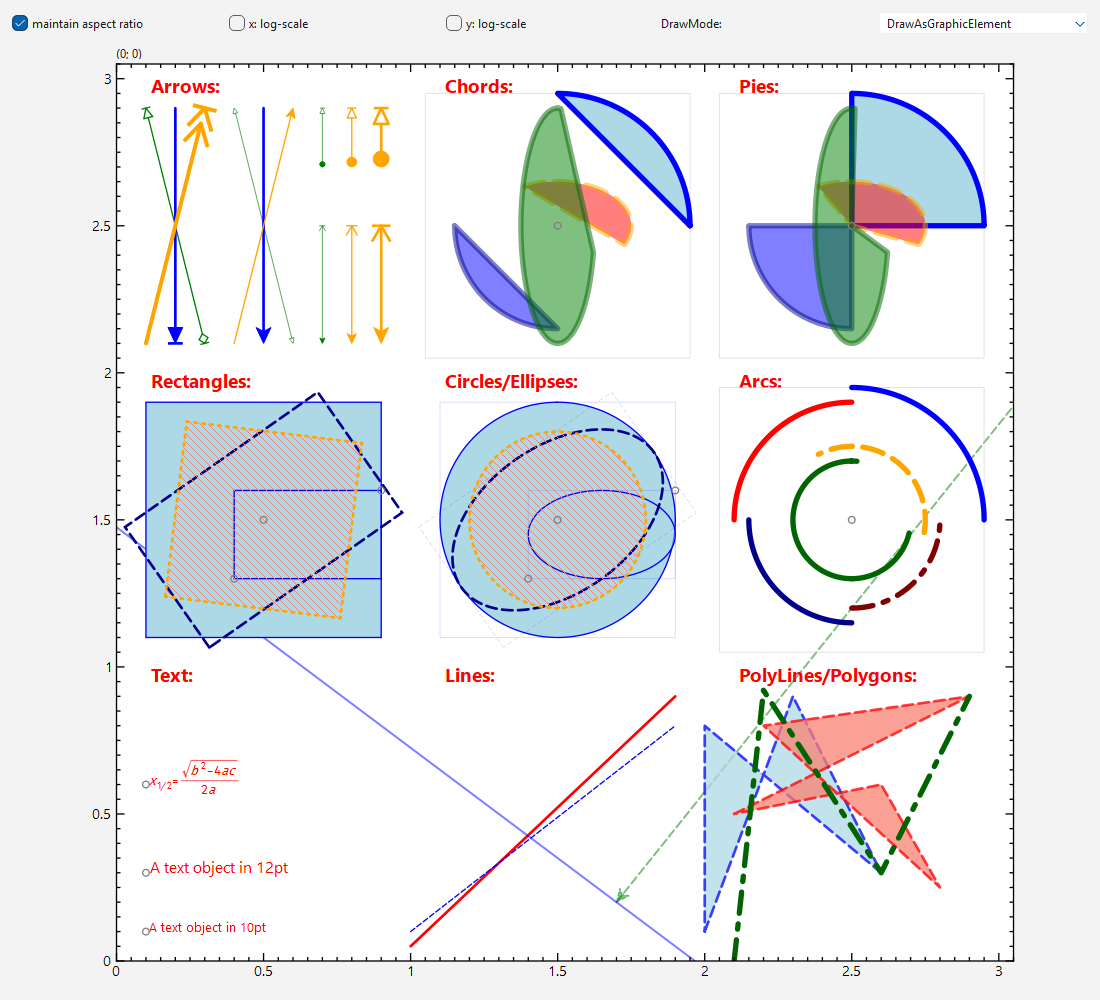
- geometric forms/annotations
- can be easily extended by deriving a new graph from JKQTPPlotElement or JKQTPPlotObject
- optional: OpenCV, CImg interfaces
- CMake-based build system
- extensive set of Examples/Tutorials: https://jkriege2.github.io/JKQtPlotter/exampletutorialprojects.html
- extensive doxygen-generated Documentation: https://jkriege2.github.io/JKQtPlotter/index.html
Screenshots
Plotting
LaTeX-Rendering
Build-In User-Interaction